Beyond Static Reports
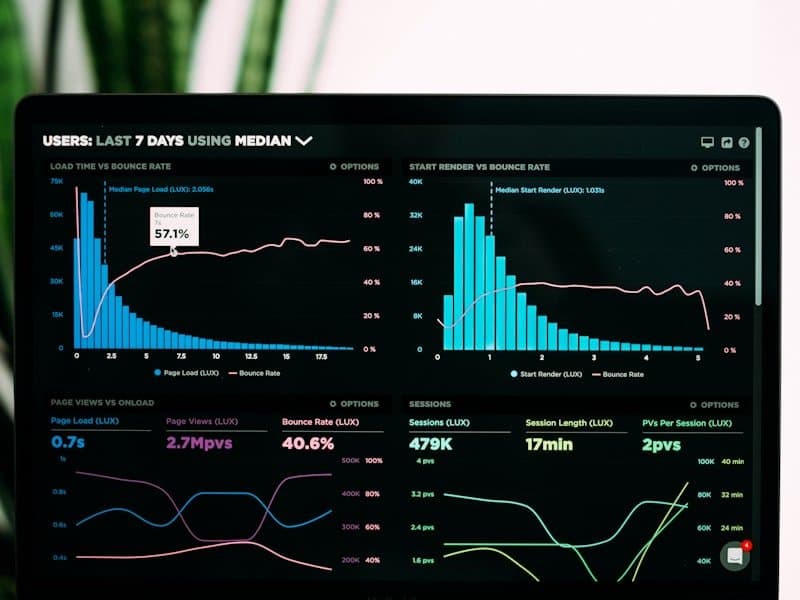
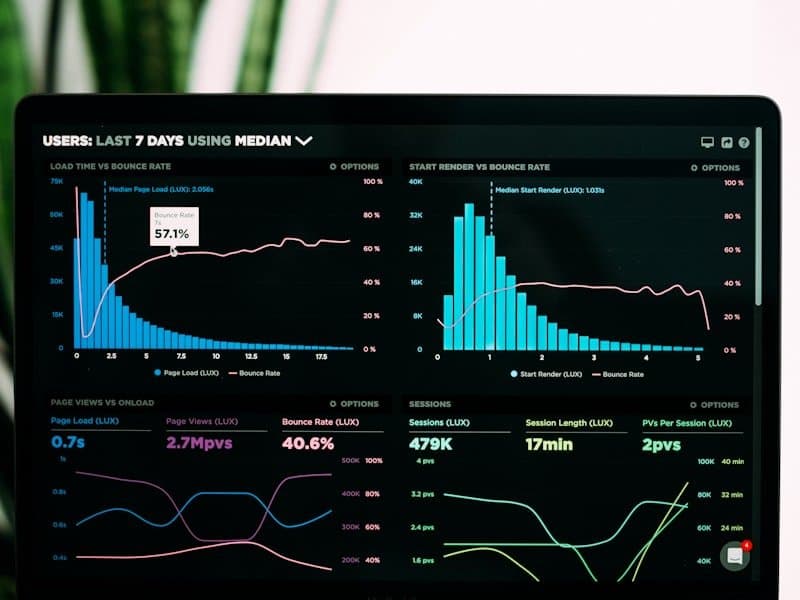
Traditional monthly reports are no longer sufficient for fast-moving businesses. Real-time dashboards give decision-makers immediate visibility into key metrics, enabling faster and more informed responses.
Designing Effective Dashboards
Know Your Audience
Different stakeholders need different views:
- Executives — High-level KPIs with trend indicators
- Managers — Operational metrics with drill-down capability
- Analysts — Detailed data with filtering and exploration tools
Visual Design Principles
- Use appropriate chart types for each metric
- Limit dashboards to 5-7 key metrics per view
- Apply consistent color coding for status indicators
- Ensure mobile responsiveness for on-the-go access
Technical Architecture
A real-time dashboard system typically includes:
- Data Sources — ERP, CRM, web analytics, IoT sensors
- Streaming Pipeline — Apache Kafka or cloud-native streaming services
- Data Store — Time-series databases for metrics, data warehouses for historical analysis
- Visualization Layer — Grafana, Metabase, or custom-built with D3.js
Performance Considerations
- Cache frequently accessed aggregations
- Use materialized views for complex calculations
- Set appropriate refresh intervals (not everything needs sub-second updates)
The goal is not just to display data, but to surface insights that drive action.