The Power of Visual Data
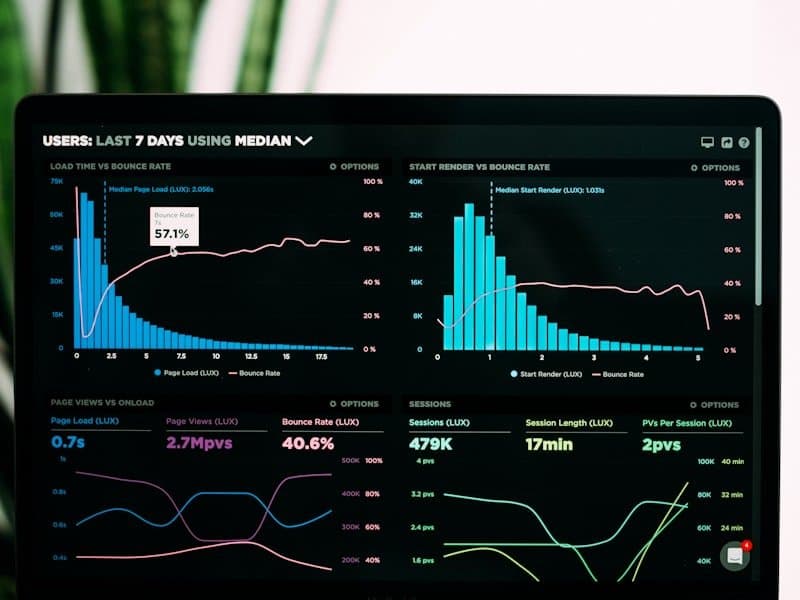
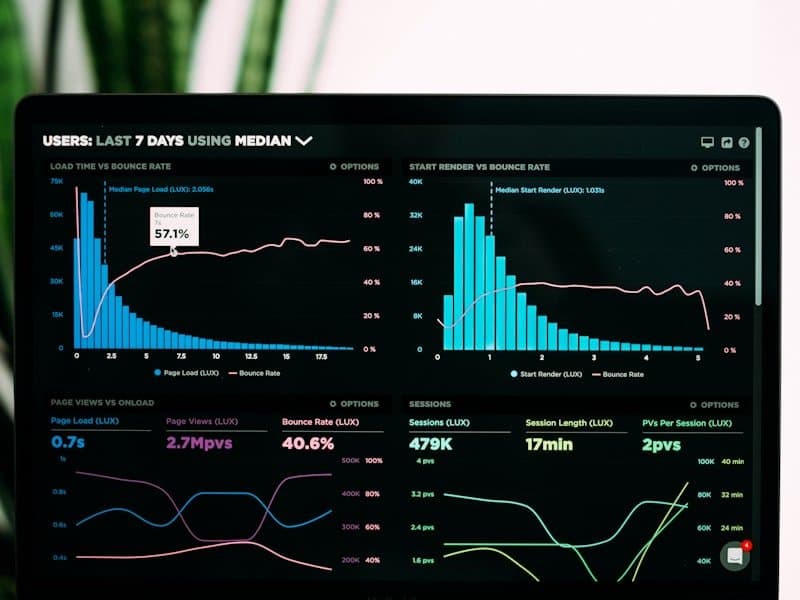
Humans process visual information 60,000 times faster than text. Effective data visualization turns complex datasets into stories that drive action.
Choosing the Right Chart Type
- Bar charts — Comparing values across categories
- Line charts — Showing trends over time
- Scatter plots — Revealing correlations between variables
- Heat maps — Displaying density and patterns in large datasets
- Pie charts — Use sparingly, only for showing parts of a whole (max 5 segments)
Design Principles
Clarity Over Decoration
- Remove chart junk (unnecessary gridlines, borders, effects)
- Use direct labeling instead of legends when possible
- Start axes at zero for bar charts to avoid misleading representations
- Use color purposefully, not decoratively
Common Mistakes to Avoid
- Too much data in one chart — Break complex views into multiple focused visualizations
- Inconsistent scales — Use the same scale when comparing related metrics
- Poor color choices — Ensure accessibility for colorblind users
- Missing context — Always include titles, labels, and data source references
Tools We Recommend
- Metabase — Open-source BI with simple query builder
- Apache Superset — Feature-rich open-source visualization
- Grafana — Best for time-series and operational dashboards
- Google Data Studio — Free, cloud-based reporting
Good visualization is not about making charts pretty — it is about making data understandable.